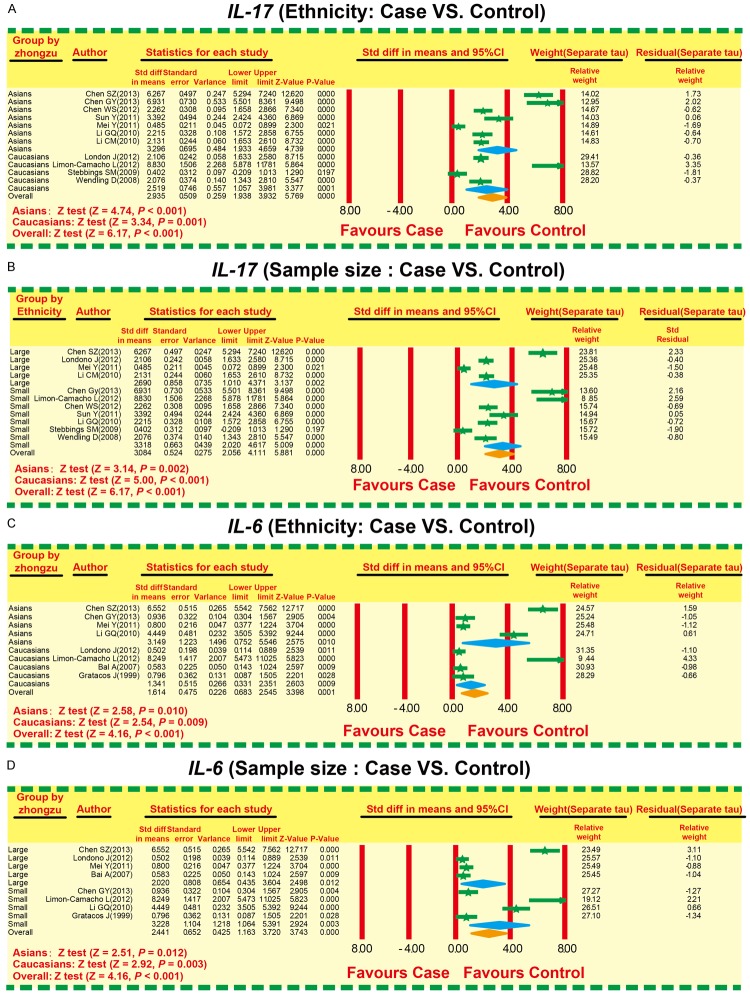
Figure 3.
Forest plots for subgroup analysis on the correlation of Interleukin-6 (IL-6) and Interleukin-17 (IL-17) serum levels with ankylosing spondylitis (A: Subgroup analysis of ethnicity on IL-17; B: Subgroup analysis of sample size on IL-17; C: Subgroup analysis of ethnicity on IL-6; D: Subgroup analysis of sample size on IL-6).

