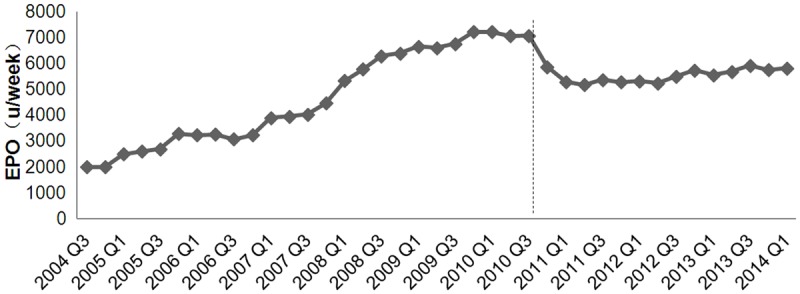
Figure 1.

Patients receiving peritoneal dialysis from July 2004 to March 2014 in our hospital were analyzed retrospectively. Their clinical data were completely preserved in the database of our peritoneal dialysis center. EPO application dose was obtained by reviewing the database. The X axis presents the weekly dose of EPO used in each quarter and the Y axis stands for the time. Dotted line represents the third quarter of 2010.
