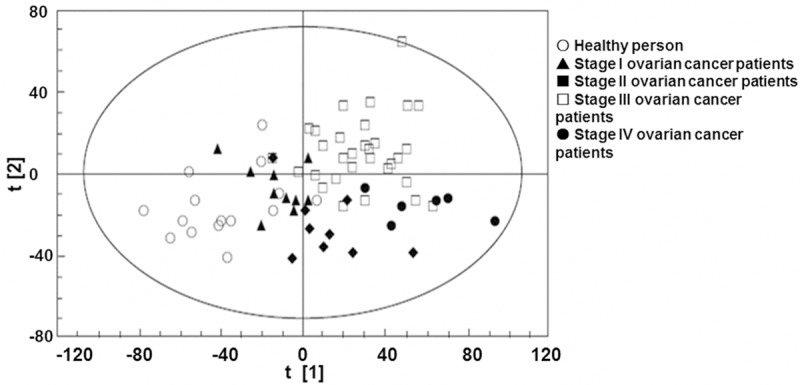
Figure 2.

PCA score plot of urine metabolism in healthy people and patients with ovarian cancer. Each point in the graph represents a sample. ○: healthy people, ▲: stage I ovarian cancer patients, ■: stage II ovarian cancer patients, □: stage III ovarian cancer patients, ●: stage IV ovarian cancer patients.
