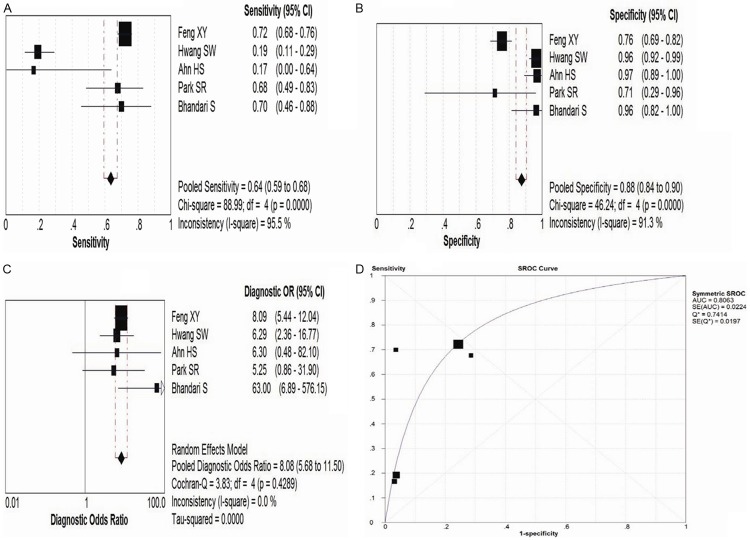
Figure 3.
The forest plot and summary ROC curve of EUS in evaluating pre-operative lymph node staging in gastric cancer patients are presented. (A-C) illustrated the forest plot of pooled sensitivity (A), specificity (B) and Diagnostic Odds Ratio (C), respectively. (D) Showed the summary ROC curve of EUS. ROC, receiver operating characteristic; EUS, endoscopic ultrasonography.

