
Figure 2.
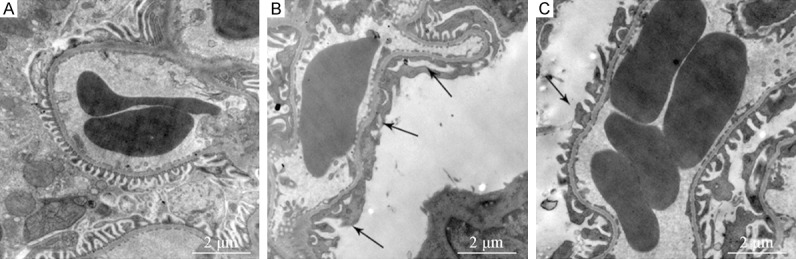
Changes of podocyte foot processes among the experimental group under TEM in the post-modeling week 8 (TEM, × 15000). Note: A for normal control (NC) group; B for diabetes mellitus control (DM) group; C for simvastatin (SVT) group.
Official websites use .gov
A
.gov website belongs to an official
government organization in the United States.
Secure .gov websites use HTTPS
A lock (
) or https:// means you've safely
connected to the .gov website. Share sensitive
information only on official, secure websites.
Changes of podocyte foot processes among the experimental group under TEM in the post-modeling week 8 (TEM, × 15000). Note: A for normal control (NC) group; B for diabetes mellitus control (DM) group; C for simvastatin (SVT) group.