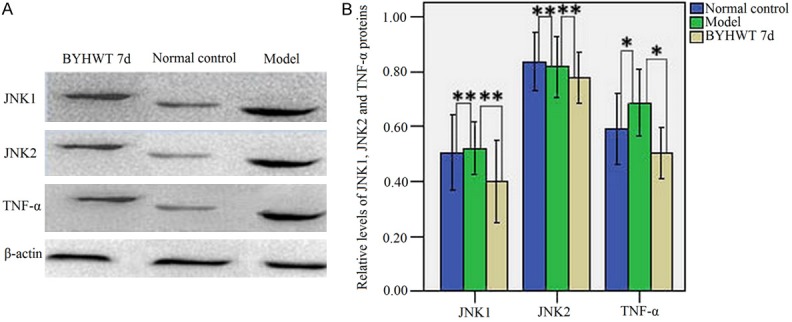
Figure 3.

A. Western blot analysis of JNK1, JNK2 and TNF-α protein levels in the injured hemisphere from all groups. β-actin was used as a loading control. Lanes 1-3 denoted the BYHWT 7d, normal control and model group, respectively. B. Relative levels of JNK1, JNK2 and TNF-α proteins expressed as ratio of optical density to β-actin for each group. *P < 0.05, **P < 0.01.
