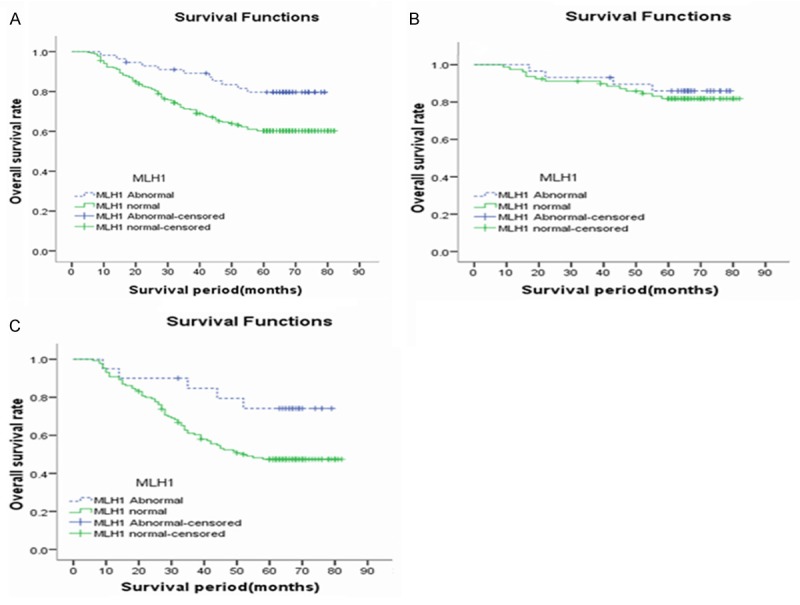
Figure 2.

Comparison of 5-year survival rate between the groups of normal and aberrant hMLH1 expression. A. Represents total patients: 5-year overall survival rate in group of aberrant hMLH1 expression was higher than normal group, with significant statistical difference (Ptotal=0.007); B. Stands for staging II patients: 5-year overall survival rate in group of aberrant hMLH1 expression was higher than normal group, with no statistical difference (PII=0.595); C. Represents staging III: 5-year overall survival rate in group of aberrant hMLH1 expression was higher than normal group, with significant statistical difference (PIII=0.036).
