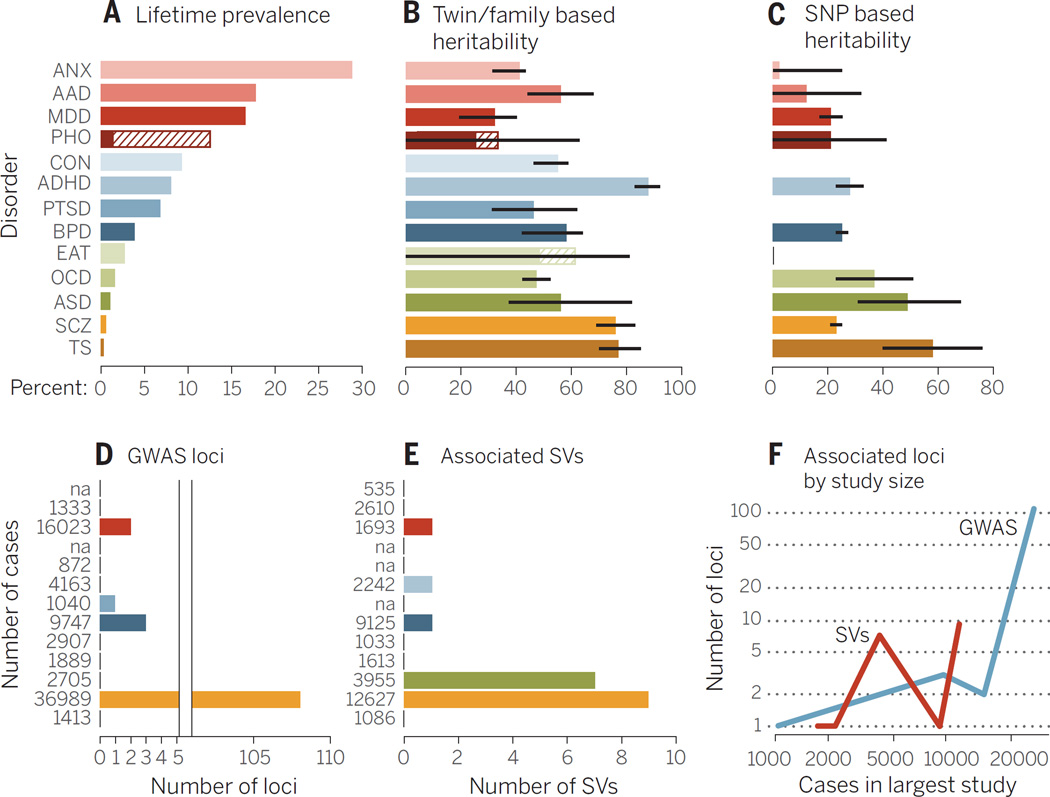
Fig. 1. Summary of genetic analyses performed on 13 psychiatric disorders.
(A) Highest lifetime (point for ASD) prevalence in percentages. The discontinuous bar in phobias represents the range in different forms. (B) Heritability estimates; bars, standard error (SE). (C) SNP-based heritability estimates; bars, SE. (D) Number of genome-wide significant loci. The x axis is discontinuous because of the large difference of associated loci between disorders. (E) The number of associated structural variants (SVs) that either reach genome-wide significance or have been replicated with P ≤ 0.01 in another study. (F) The y axis shows associated GWAS loci (blue) and SVs (green) by the number of cases (x axis) in the largest study for that disorder. The number of cases in the largest study for GWAS (D) and SV studies (E) is reported next to each disorder. Abbreviations are as follows: ANX, any anxiety disorder; AAD, alcohol abuse disorder; MDD, major depressive disorder; PHO, = any phobia; CON, conduct disorders; PTSD, post traumatic stress disorder; EAT, eating disorders; TS, Tourette syndrome. The order of disorders and their color coding are maintained throughout the bar plots. See table S1 for underlying data and references amalgamated from many sources.

