
Figure 3.
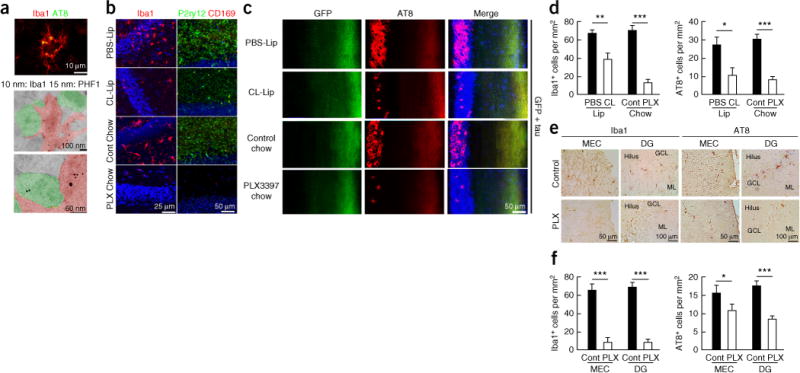
Microglial depletion suppresses tau propagation in the DG of AAV-GFP/tau-injected mice and PS19 tau mice. (a) Colocalization of tau with microglia in the hippocampal region of PS19 (P301S tau transgenic) mouse brain by laser-scanning confocal microscopy (top) and immunogold electron microscopy with two different gold particle sizes (middle and bottom). (b) Microglia depletion of AAV-GFP/tau mice by ICV injection of clodronate liposome (CL-Lip) or feeding with PLX3397 chow (290 p.p.m.), followed by immunofluorescence for Iba1 (mononuclear phagocyte marker; left, red), or P2ry12 (right, green) and CD169 (infiltrating monocyte marker, red) in the DG. (c) Immunofluorescence for AT8 (red), GFP (green) and DAPI (blue) in the DG at 28 dpi. (d) Quantification of the number of Iba1+ and AT8+ cells in the GCL of AAV-GFP/tau mice in c. Iba1+ cells in the PBS group (n = 3 mice, 18 sections) and CL group (n = 3 mice, 18 sections): P = 0.0013, t(34) = 3.506; Iba1+ cells in control (n = 4 mice, 16 sections) and PLX33973397 chow groups (n = 4 mice, 11 sections), P < 0.0001, t(25) = 7.185; AT8+ cells in PBS (n = 3 mice, 16 sections) and CL groups (n = 3 mice, 14 sections): P = 0.017, t(28) = 3.470; AT8+ cells in control (n = 4 mice, 18 sections) and PLX3397 chow groups (n = 4 mice, 16 sections): P < 0.0001, t(32) = 4.605. All unpaired t-tests. (e) Microglial depletion in the PS19 mice at 4.5 months of age after feeding PLX3397 chow for 4 weeks, followed by immunohistochemistry for Iba1 (red) and AT8 (red) and quantification of the number of Iba1+ and AT8+ cells in the MEC and DG. (f) Quantification of the number of Iba1+ and AT8+ cells in the GCL of PS19 mice in e. Iba1+ cells in the MEC in control (n = 4 mice, 23 sections) and PLX3397 chow groups (n = 3 mice, 12 sections): P < 0.0001, t(33) = 7.647; Iba1+ cells in the DG in control (n = 4 mice, 20 sections) and PLX3397 chow groups (n = 3 mice, 11 sections), P < 0.0001, t(32) = 10.35; AT8+ cells in control (n = 4 mice, 19 sections) and PLX3397 chow groups (n = 4 mice, 14 sections): P = 0.033, t(28) = 2.243, AT8+ cells in control (n = 4 mice, 18 sections) and PLX3397 chow groups (n = 4 mice, 14 sections): P < 0.0001, t(30) = 4.791. All unpaired t-tests. Error bars represent s.e.m. *P < 0.05, **P < 0.01 and ***P < 0.001 as determined by unpaired Student’s t-test.