
Figure 5.
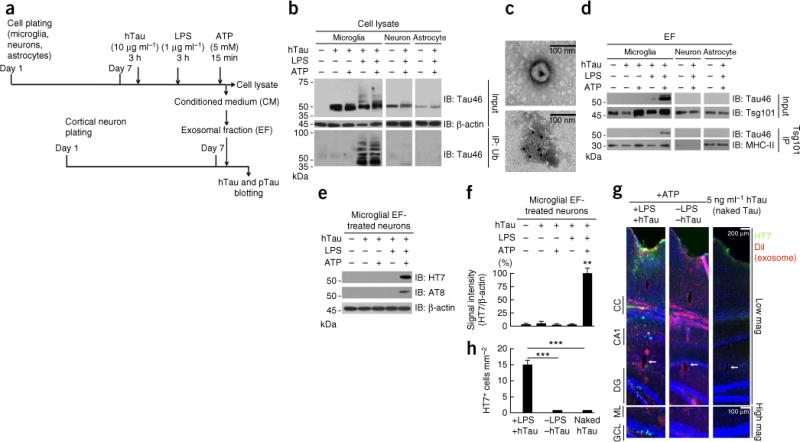
Microglia phagocytose and secrete human tau in exosomes, which facilitates tau propagation to neurons in vitro and in vivo. (a) Experimental timeline for in vitro tau transmission from primary cultured murine microglia, neurons or astrocytes to neurons. (b) Cell lysates (Input) were immunoblotted (IB) for total tau (Tau46) and β-actin (upper panels), or subjected to immunoprecipitation (IP) with anti-ubiquitin (Ub) antibody and immunoblotting with Tau46 (lower panels). (c) Electron micrograph of purified exosomes from microglia (top) and immunoelectron micrograph of exosomes with Tsg101 immunogold labeling (10-nm gold particles, bottom). (d) The exosomal fraction (EF) separately collected from conditioned media was immunoblotted for Tau46 or Tsg101 (upper panels). The EF was also subjected to immunoaffinity purification with Tsg101 antibody and immunoblotted for Tau46 or MHC-II (another exosomal marker, lower panels). (e) The EF was applied to primary cultured murine cortical neurons for 4 h, and after washing, the neuron cell lysates were tested for the uptake of hTau with HT7 or AT8. Results are representative of 3 independent experiments. (f) Quantification of band intensity in c. **P < 0.0001, F(4,10) = 253.3, n = 3 per group as determined by one-way ANOVA and Tukey post hoc test. Error bars in b and c represent s.e.m. (g) The DiI-labeled EF containing tau (+LPS +tau) or no tau (−LPS −tau), or 5 ng μl−1 of naked human tau aggregates, were injected into the OML of DG in C57BL/6 mice and sacrificed 21 dpi for immunofluorescence for HT7 (green), exosome (DiI, red) and DAPI (blue) labeling along the injection tract (top) and in the DG regions (bottom). CC, corpus callosum; arrows, injection site in the OML. (h) Quantification of HT7+ cells. Error bars represent s.e.m. ***P < 0.0001, F(2,27) = 36.08 as determined by one-way ANOVA and Tukey post hoc test for +LPS +tau (n = 4 mice, 12 sections), −LPS −tau (n = 3 mice, 9 sections) and naked tau (n = 3 mice, 9 sections) groups. Full-length blots are presented in Supplementary Figure 10.