
Figure 6.
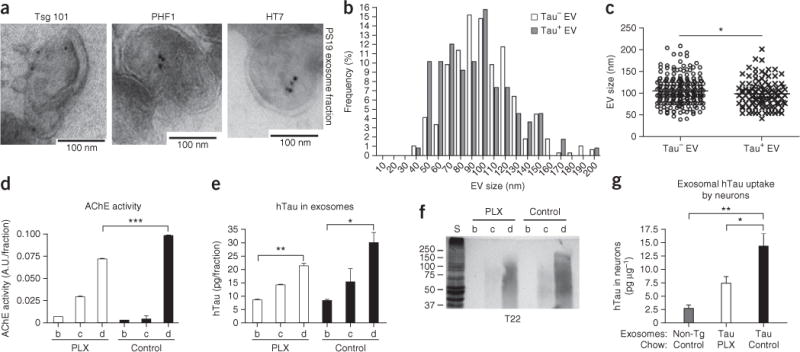
Characterization of tau-containing extracellular vesicles from microglia depleted PS19 mouse brain. (a) Electron micrograph from the exosomal fraction of PS19 tau mouse brains. Immunogold labeling of Tsg101 (exosome), PHF1 (pTau) and HT7 (hTau). (b,c) Histogram of the size of tau+ (n = 107) or tau− extracellular vesicles (EVs, n = 261) (b) and their quantification (c). *P = 0.0371, t(366) = 2.092 as determined by unpaired Student’s t-test. (d) AChE activity of sucrose gradient ultracentrifugation fractions. A.U., arbitrary units. ***P < 0.0001, F(5,6) = 539.3 as determined by one-way ANOVA and Tukey post hoc test (n = 3 per group). (e) Quantification of hTau in each fraction by hTau-specific ELISA. P = 0.0078, F(5,6) = 9.632 as determined by one-way ANOVA and Tukey post hoc test (n = 3 per group). (f) Immunoblotting of tau oligomers using T22 antibody. (g) Ten micrograms of fraction d (exosome fraction) from non-transgenic (non-Tg), PS19 tau mice with a 4-week treatment with PLX3397 chow (tau PLX) or PS19 mice with control chow treatment (tau control) were applied to primary cultured murine cortical neurons as described in Figure 5a, and exosome-transferred hTau in the neurons was quantified by hTau ELISA. P = 0.0026, F(2,9) = 12.34 as determined by one-way ANOVA and Tukey post hoc test (n = 3 per group). Error bars represent s.e.m. *P < 0.05 and **P < 0.01. Results are representative of 3 independent experiments.