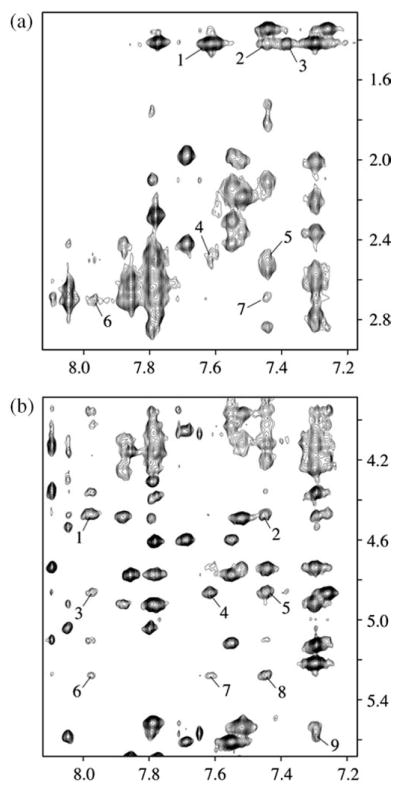
Figure 4.
Expanded NOESY (250 ms mixing time) contour plots for the 10R-(−)-trans-anti-[BP]G adduct in the meC-[BP]G-C sequence context at the 11-mer duplex level. Spectra are in 100 mM NaCl, 10 mM phosphate, 2H2O, pH 6.8 at 0 °C. The numbered cross-peaks correspond to NOEs from benzo[a]pyrenyl protons to methyl and sugar H2′,2′′ protons (a) and to cytosine H5 and sugar H1′ protons (b). In (a), the cross-peaks 1–7 are assigned as follows: 1, BP(H1,H2)-[Me]C5(CH3); 2, BP(H12)-[Me]C5(CH3); 3, BP(H3)-[Me]C5(CH3); 4, BP(H1,H2)-[Me]C5(H2′ ); 5, BP(H12)-[Me]C5(H2′); 6, BP(H11)-[BP]G6(H2′′); 7, BP(H12)-[BP]G6(H2′′). In (b), the cross-peaks 1–9 are assigned as follows: 1, BP(H11)-C7(H1′); 2, BP(H12)-C7(H1′ ); 3, BP(H11)-C7(H5); 4, BP(H1,H2)-C7(H5); 5, BP(H12)-C7(H5); 6, BP(H11)-[Me]C5(H1′); 7, BP(H1,H2)-[Me]C5(H1′ ); 8, BP(H12)-[Me]C5(H1′ ); 9, BP(H6)-G18(H1′).

