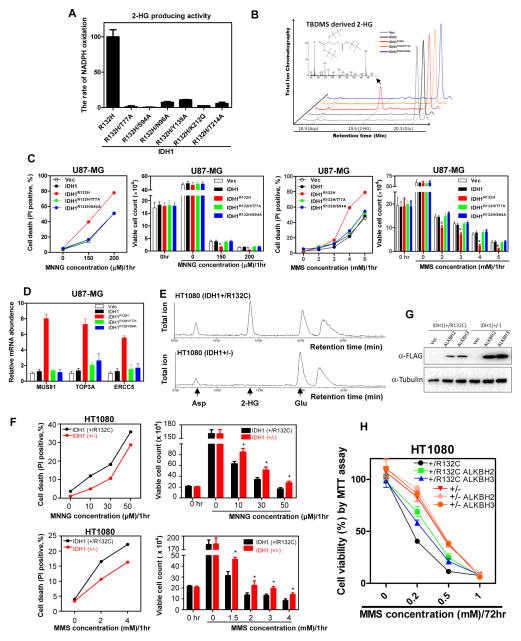
Figure 3. Alkylating agents sensitizing effect of mutant IDH1 is dependent on 2-HG.
(A, B) Characterization of 2-HG producing activity of IDH1 double mutants. The activity of various IDH1 double mutants in producing 2-HG was determined by both the rate of NADPH oxidation (A) and GC-MS analysis (B). Peaks at 19.6 min were identified as bis-TBDMSD derived 2-HG by the mass fragment spectra. The bis-TBDMS 2-HG-specific 433-m/z fragment is shown in the insert. Moreover, the peaks at 18.9 min and 20.3 min were identified as the derivatives of aspartate (Asp) and glutamate (Glu), respectively. ** indicates p < 0.01 by student’s t-test between IDH1R132H and IDH1.
(C) U87-MG cells stably expressing the indicated proteins were exposed to increasing concentrations of MNNG or MMS. Cell death was assessed by performing flow cytometry analysis and trypan blue staining for viable cell counting.
(D) The mRNA expression of selected DNA repair genes was tested in U87-MG cells stably expressing the indicated proteins, as determined by qRT-PCR analysis.
(E) HT1080 (IDH1+/−) cell line was generated by knocking-out the R132C allele in parental HT1080 (IDH1+/R132C) cells using TALEN technique. Metabolites extracted from HT1080 (IDH1+/−) and parental HT1080 (IDH1+/R132C) cells were subjected to GC-MS analysis, showing the loss of 2-HG accumulation in HT1080 (IDH1+/−) cells.
(F) HT1080 (IDH1+/−) and parental HT1080 (IDH1+/R132C) cells were exposed to increased concentrations of MNNG or MMS. Cell death was assessed by performing flow cytometry analysis and trypan blue staining for viable cell counting. Shown are average values of triplicated results with standard deviation (S.D.). *denotes the p < 0.05 for HT1080 (IDH1+/−) versus parental HT1080 (IDH1+/R132C) cells.
(G, H) Parental HT1080 (IDH1+/R132C) and TALEN-edited HT1080 (IDH1+/−) cells stably expressing FLAG tagged ALKBH2 or ALKBH3 were established by retrovirus transduction. Expression of ALKBH was verified by western blot (G). The sensitivity of both IDH1+/R132C and IDH1+/− cells to MMS was determined by MTT assay (H).

