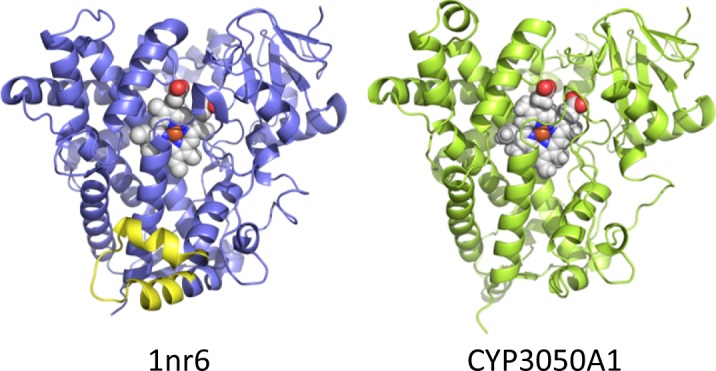
Fig 3. Structural modeling of S. mansoni CYP450 (CYP3050A1) and comparison to the structure determined for rabbit CYP450 2C5 (1nr6_a) [38].

The heme is shown is each model as a space-filling projection. The J and J’ helices in rabbit CYP450 2C5, which are absent in S. mansoni CYP450, are highlighted in yellow.
