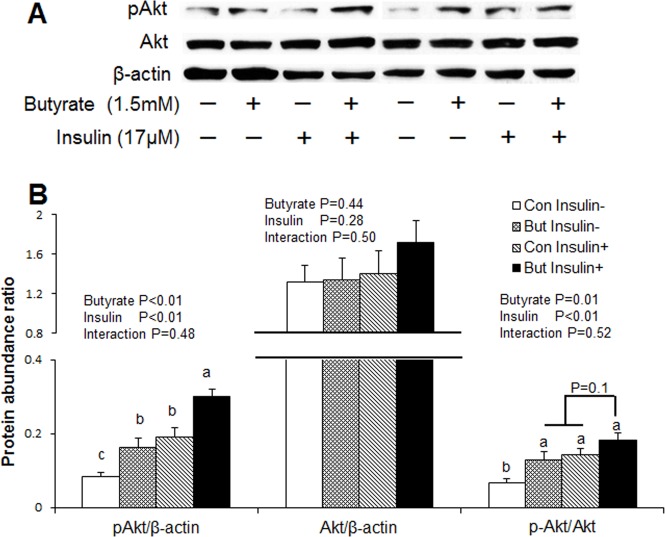
Fig 4. Effects of butyrate on AKT activation in adipocytes.
(A) Representative immunoblotting analysis of AKT in adipocytes. (B) Quantification analysis of AKT in adipocytes. Cells were treated with butyrate at 1500 μM throughout the differentiation period (day 0 to 8). On day 8, cells were incubated overnight with DMEM/F12 containing 0.1% BAS in the absence of insulin. On day 9, Butyrate-treated and untreated cells were incubated in the absence or presence of 17 μM insulin for 30 min and then harvested for immunoblotting. Data were analyzed by two-way ANOVA with Tukey multiple comparison test. Data are means ± SE (n = 6). Different letters on bars indicate significant differences (P<0.05).

