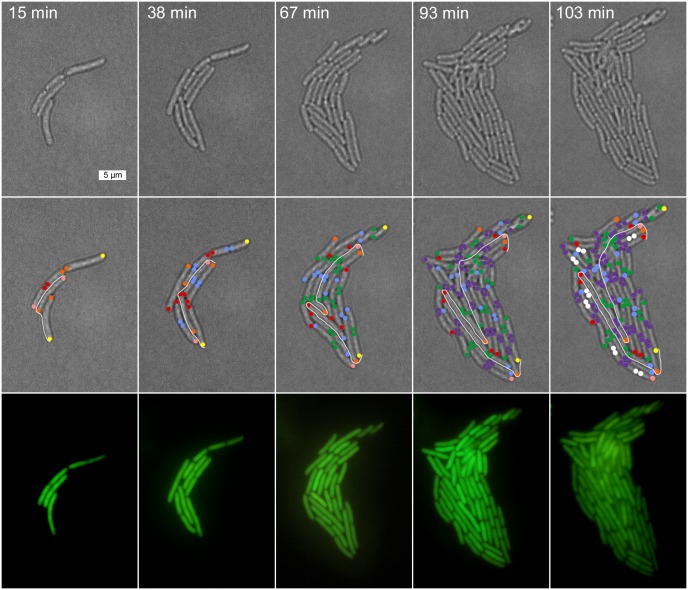
Fig 1. Tracking of individual cells perfused at pH 6.0.
The panel above displays time-lapsed images captured during the tracking of cells in a colony for a representative experiment at pH 6.0. Cells are located manually within a field and then followed through six consecutive divisions. The first row of phase contrast images are the original images captured during the experiment. Color coded images below are the phase contrast images marked with relative pole ages (same color scale appearing in lineages). The bottom row of images are corresponding fluorescent images captured at the same time interval as phase contrast images. Scale bar = 5 μm. Time stamps indicate elapsed time from start of the experiment.

