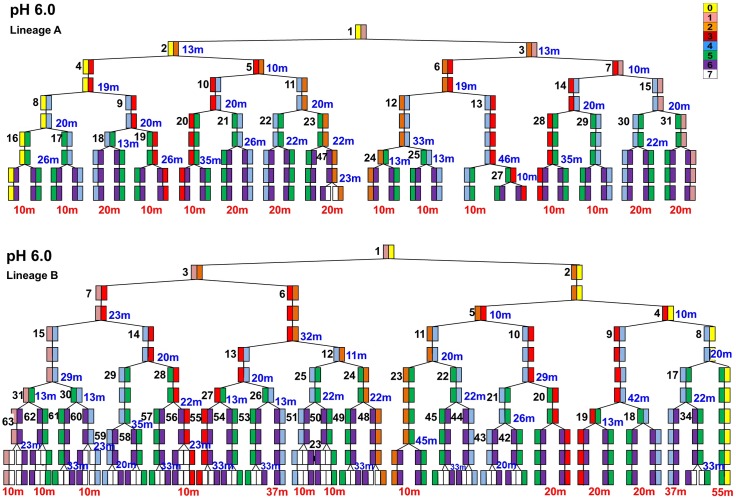
Fig 3. Cell half-lineages A and B in colonies perfused at pH 6.0.
Half-lineages A and B each include six generations of cells dividing. Each box represents a single cell at that time point. Individual poles of the cell and their corresponding pole age are labeled according to the color scale in the upper right hand corner. Each cell in the half-lineage is given a distinct number (left of the box). Cell numbers are standardized across all lineages. Colors correspond to the relative polar ages of each cell. Time (min) at each box indicate the division time of that cell, the time from initial existence of the cell until the point where it divided into two daughter cells. Time (min) in red beneath the final division indicates the time the cell existed until the experiment was ended.

