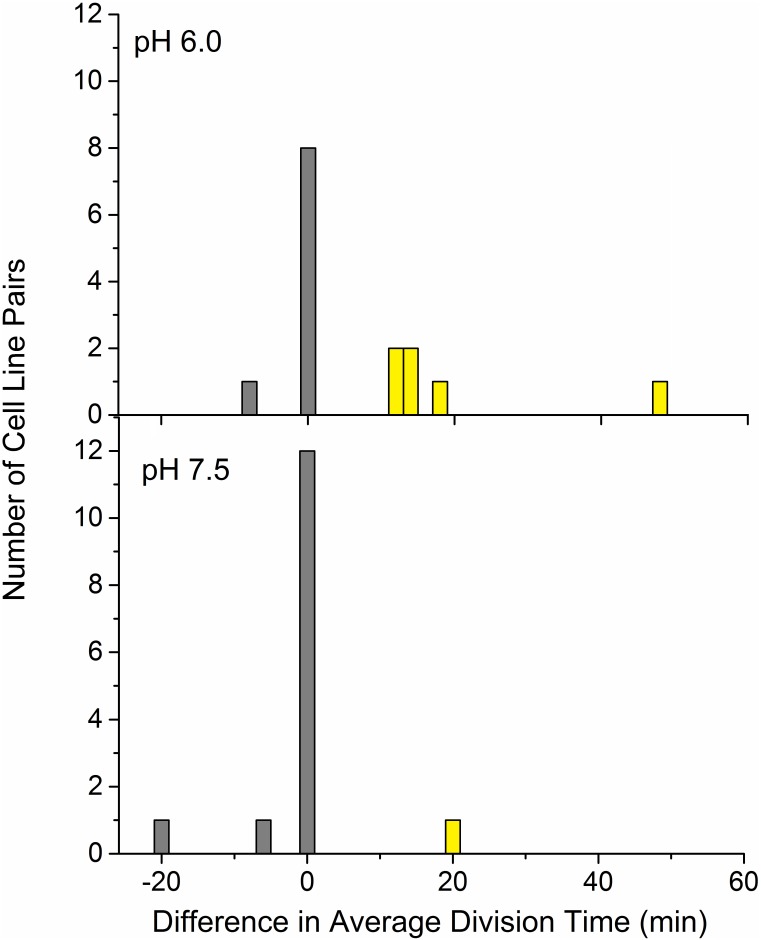
Fig 5. Differences in mean division rates of old-pole and new-pole cell lines.
The stacked histograms represent the differences in average division times (old-pole cell line minus new-pole cell line) for each half-lineage. Mean division times for the old-pole line and new-pole line were calculated for each lineage, resulting in replicate pairs. The distribution of these pairwise differences is non-normal (Anderson-Darling p-value < 0.005, indicating strong deviation from normality). Non-parametric tests were used including a Wilcoxon signed rank test and a resampling permutation test.

