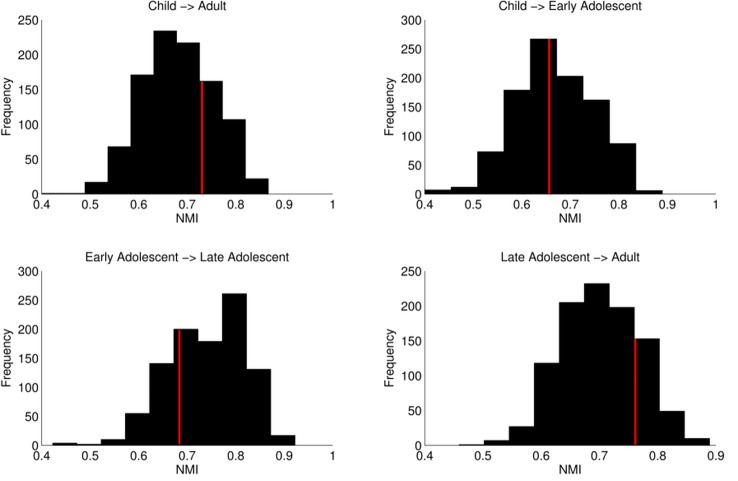
Fig 2. Comparison of observed NMI to a null distribution.
Red lines denote the observed value for NMI. This value was plotted against a null distribution for each subsequent age group comparison and between children and adults. For each comparison, observed values fell maximally just over one standard deviation from the mean of the null distribution. Importantly, this effect was not restricted to the network density represented here (see S1 Table). (Data available at http://devrsfmri_2015.projects.nitrc.org/devrsfmri_2015.tar.bz2.)

