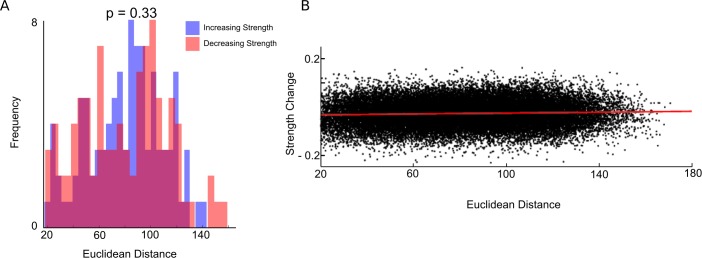
Fig 4. Developmental changes in connectivity strength are not a function of distance.
(A) Distance distributions of significantly increasing connections (blue) and significantly decreasing connections (red) between the child and adult group. No significant difference was found between the two distributions, indicating a lack of evidence for distance-dependent effects on change in connectivity strength (p = 0.33). (B) Each point represents a pairwise relationship between two regions of interest. Data values represent the difference found by subtracting the averaged child matrix from the averaged adult matrix, plotted as a function of the Euclidean distance between regions of interest. No significant relationship was found between changes in correlation strength and distance (p > 0.05). (Data available at http://devrsfmri_2015.projects.nitrc.org/devrsfmri_2015.tar.bz2.)

