
Fig 7. Regional increases in participation coefficient.
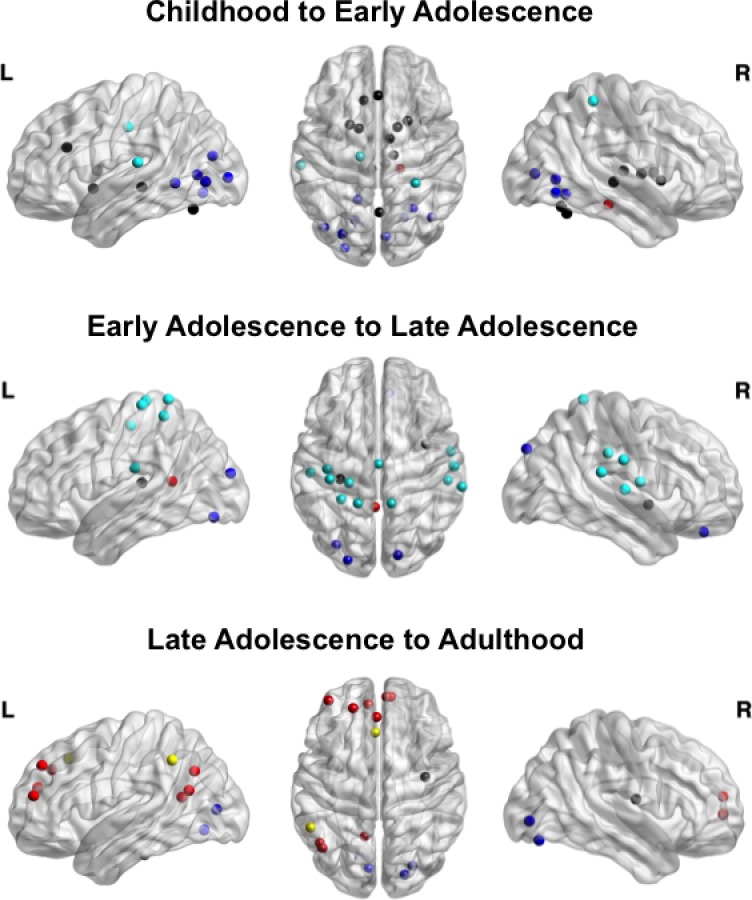
Node color represents network affiliation as defined in Fig 1. In the transition from childhood to adolescence, most regional increases were localized to the CO/Salience network, corroborating network-level findings. During adolescence, regional increases were mostly within the SM network, while regions within the DM network and FP network increased in integration from late adolescence into early adulthood. (Data available at http://devrsfmri_2015.projects.nitrc.org/devrsfmri_2015.tar.bz2.)