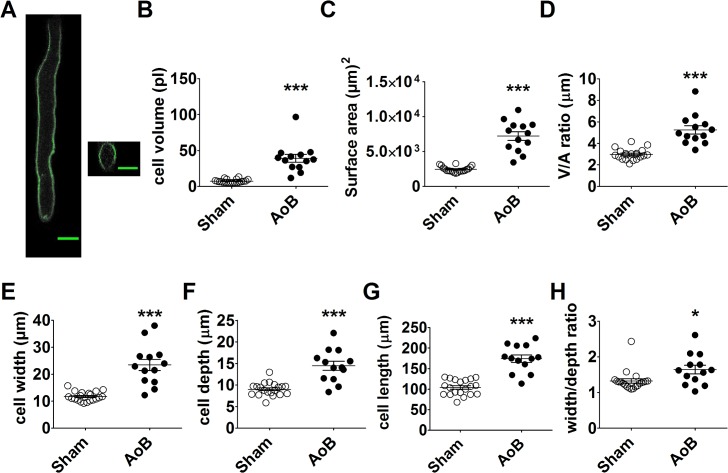
Fig 1. Left atrial myocyte hypertrophy.
(A) left hand panel; total projected density of a series of x-y laser scanning images at various depths within an AoB left atrial myocyte stained with di-8-ANEPPS. Right hand panel; y-z section through the cell. Scale bar represents 20 μm. B–G respectively, cell volume (B), cell surface area (C), volume:surface area ratio (D), cell width (E), cell depth (F) and cell width:depth ratio of left atrial myocytes from Sham (open circles, n/N = 20/3) and AoB (filled circles, n/N = 13/3). Horizontal lines represent mean ± SEM. ###, P<0.0001, Student’s unpaired t-test.

