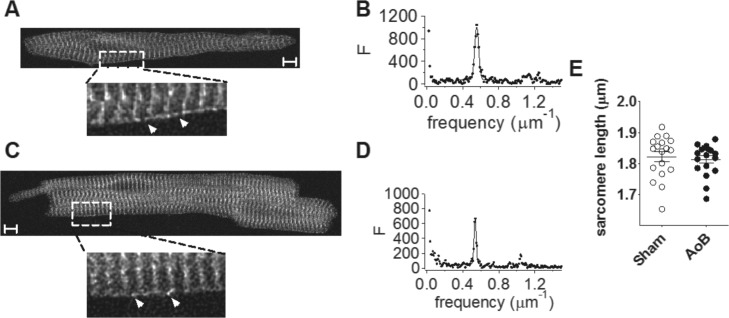
Fig 3. Ryanodine receptor location.
(A) representative image from a Sham left atrial myocyte. Lower image, higher magnification view of area indicated by dotted box. Arrows indicate intra-sarcomeric RyR at the cell periphery. (B) power spectrum of longitudinal scan along the cell. (C) representative image from an AoB left atrial myocyte. Lower image, higher magnification view of area indicated by dotted box. (D) power spectrum of longitudinal scan along the cell. Scale bars represent 5 μm. (E) sarcomere length. Data from 18/3 Sham cells/hearts and 18/3 AoB cells/hearts.

