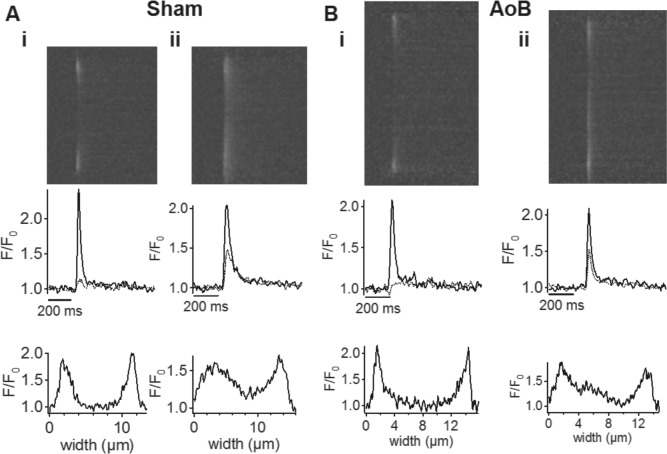
Fig 4. Left atrial myocyte Ca2+ transients in pressure-overload.
(A) Upper panels: representative averaged line-scan images taken transversely across left atrial myocytes from Sham-operated rats. Middle panels: corresponding changes in [Ca2+]i on the same time scale as the line-scan images. Black trace represents the signal at the edge of the cell, gray trace represents the signal in the center of the cell. Lower panels: transverse profile across the cell at the peak of the Ca2+ transient. (B) Upper panels: representative averaged line-scan images taken transversely across left atrial myocytes from AoB rats. Middle panels: corresponding changes in [Ca2+]i on the same time scale as the line-scan images. Black trace represents the signal at the edge of the cell, gray trace represents the signal in the center of the cell. Lower panels: transverse profile across the cell at the peak of the Ca2+ transient. Cells were stimulated at 1 Hz.

