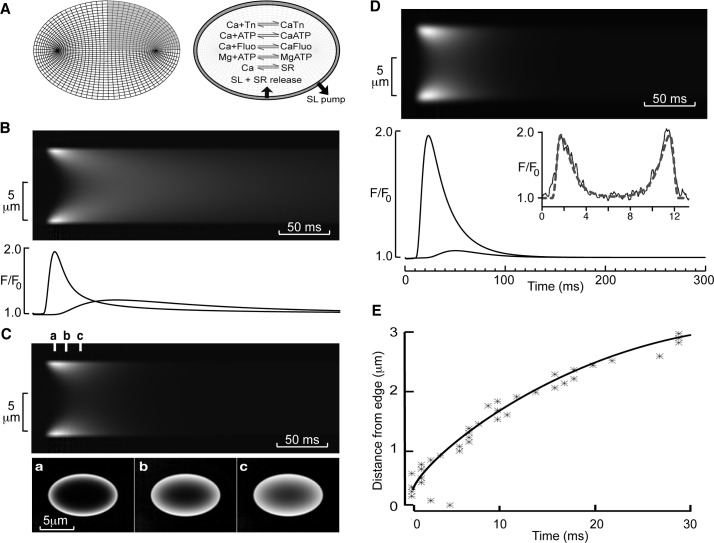
Fig 5. Modeling of diffusion in rat left atrial myocytes.
(A) Model discretization with an elliptical grid and the Ca2+ reactions incorporated in the model representing Ca2+ buffering and fluxes. (B) Upper panel shows a simulated line scan image assuming release of Ca2+ only at the periphery of a cell and no internal Ca uptake. Lower panel shows relative fluorescence changes at the cell edge and cell center. Note the slow rate of decline of Ca2+ in the cell center. (C) Upper panel shows a simulated line scan image with SR Ca2+ uptake included. Lower panel shows the time course of fluorescence changes at the time points indicated by a, b and c in the upper panel. (D) Upper panel shows calculated line scan image including microscope blurring. Lower panel shows fluorescence changes at the edge and center of the cell model. The inset shows the radial profile at the peak of the transient for the model (dotted line) and exemplar experimental data (solid line). Note the close agreement between these data. (E) The time-dependence of spread of the peak fluorescence for the model (solid line) and exemplar experimental data (stars).

