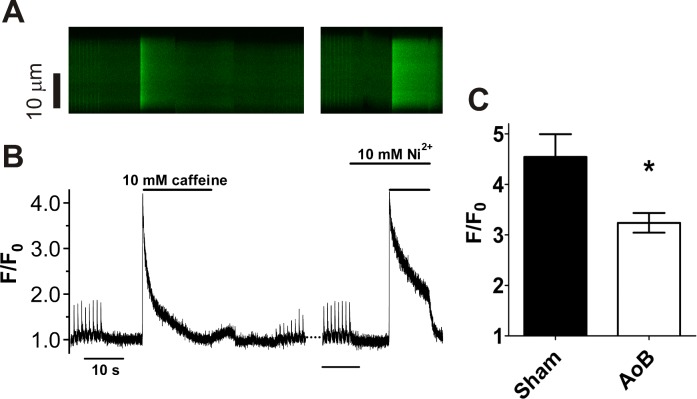
Fig 6. Caffeine-induced Ca2+ release.
(A) representative line scan image of Ca2+ release triggered by caffeine (10 mM). Example is from a Sham myocyte. Time scale as shown in B. (B) time course of changes in spatially averaged [Ca2+]i of the cell shown in A. Horizontal and vertical lines axes indicate [Ca2+]i and time scale, respectively. (C) Mean (±SEM) peak F/F0 in the presence of caffeine in Sham (n/N = 10/5) and AoB (n/N = 13/6) cells. *, P<0.05, unpaired t-test.

