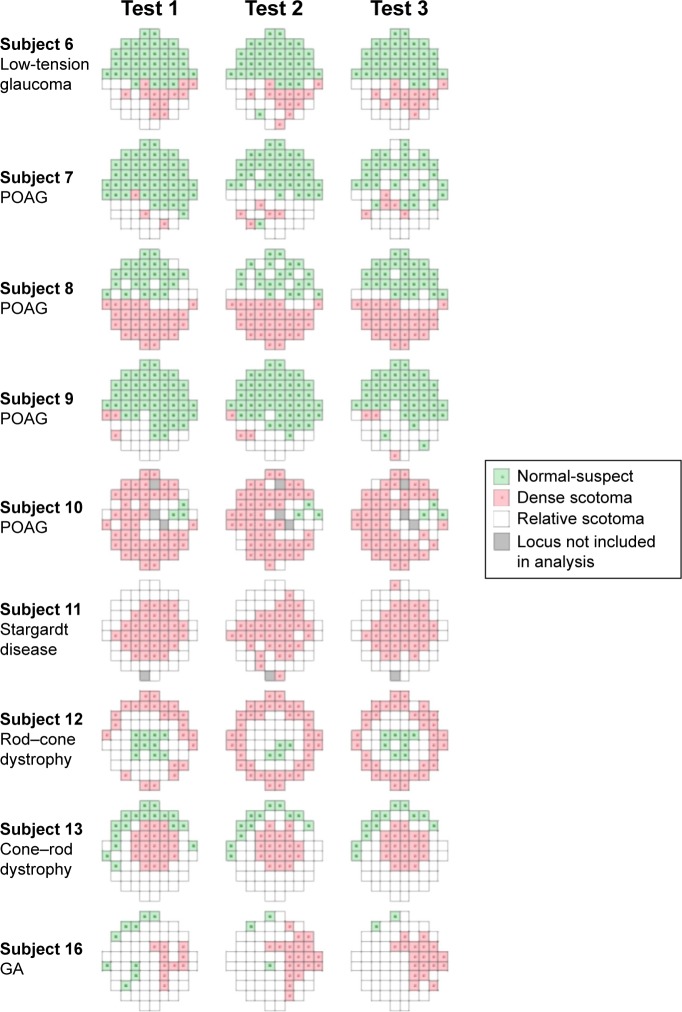
Figure 4.
Graphical representation of areas of normal-suspect loci (green squares), relative scotomas (white squares), and dense scotomas (red squares) for the nine subjects with dense scotomas.
Note: Gray squares denote loci not used in the analysis due to errors in projection or local defect classification.
Abbreviations: POAG, primary open-angle glaucoma; IRD, inherited retinal dystrophy; GA, geographic atrophy.

