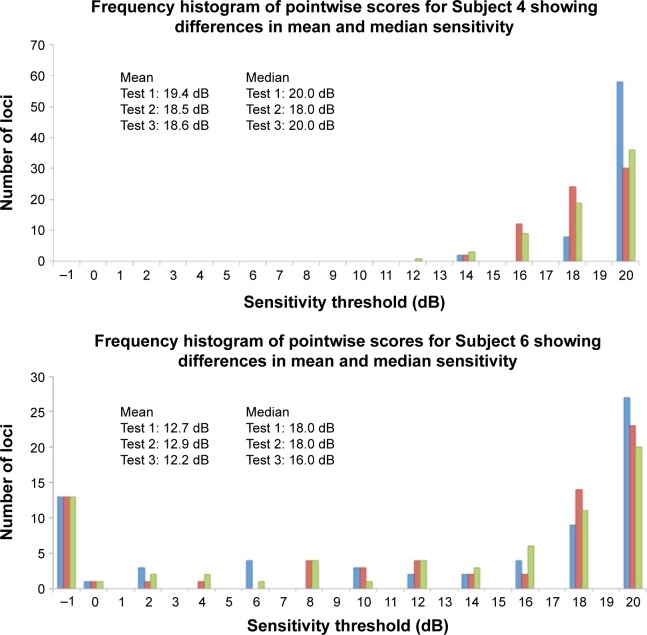
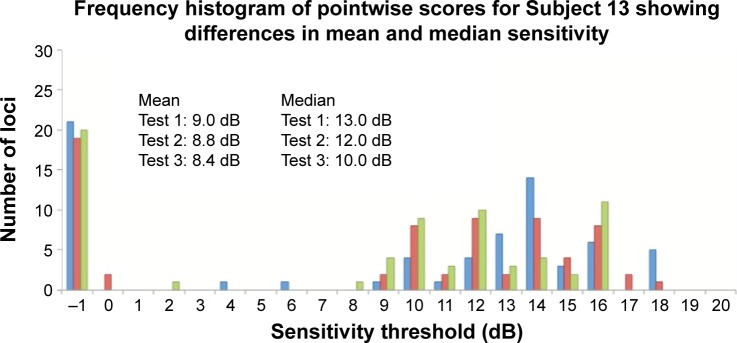
Figure 5.
Frequency histogram for Subjects 4 (normal), 6 (glaucoma), and 13 (inherited retinal dystrophy) with results from Test 1 (blue bars), Test 2 (red bars), and Test 3 (green bars).
Note: None of the examples demonstrate Gaussian distribution, and all were typical for their diagnostic category.


