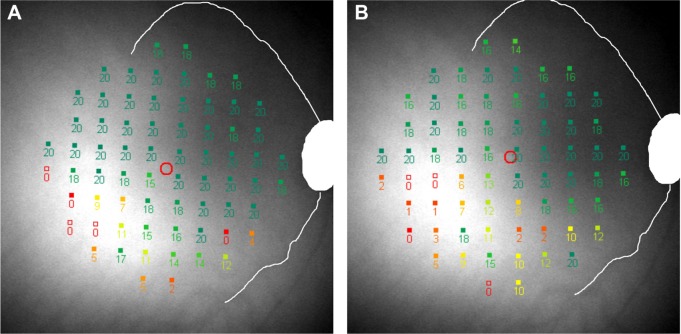
Figure 6.
A closer inspection of threshold measures for Subject 9 at visits 2 (A) and 3 (B) show that the test grid has shifted temporally and rotated counterclockwise with respect to the optic disc and vascular arcades, causing complete discrepancy of scotoma mapping.
Note: Retinal sensitivity values are represented by numbers (0–20) and overlaid on the fundus image. Discrepancy of scotoma mapping is due to a registration error occurring during the follow-up test when the Nidek software performs automated imaging registration.

