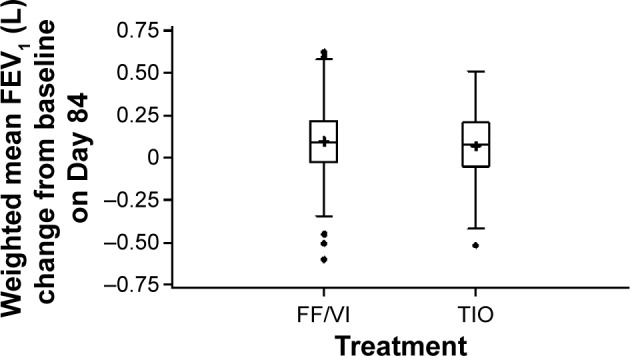
Figure 2.

Box plot of change from baseline in 24-h weighted mean FEV1 (L).
Notes: Box represents the IQR, midline represents the median, + represents the mean, whiskers represent 1.5× IQR, circles represent subjects exceeding 1.5× IQR. P=0.201.
Abbreviations: FEV1, forced expiratory volume in 1 second; FF/VI, fluticasone furoate/vilanterol (100/25 mcg); h, hours; IQR, interquartile range; TIO, tiotropium (18 mcg).
