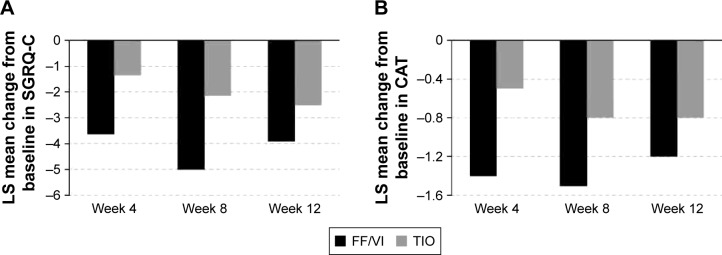
Figure 4.
Least squares mean change from baseline in (A) total SGRQ-C score and (B) total CAT score at Weeks 4, 8, and 12.
Notes: The LS mean change difference between groups for Week 4 was (A) −2.25 (95% CI −4.00 to −0.51) and (B) −0.9 (95% CI −1.8 to 0.0), for Week 8 was (A) −2.84 (95% CI −4.70 to −0.99) and (B) −0.7 (95% CI −1.6 to 0.2), and for Week 12 was (A) −1.38 (95% CI −3.38 to 0.62) and (B) −0.4 (95% CI −1.3 to 0.5). The MCID of −4 is indicated by a dotted line.
Abbreviations: CAT, COPD Assessment Test; CI, confidence interval; FF/VI, fluticasone furoate/vilanterol (100/25 mcg); LS, least squares; MCID, minimal clinically important difference; SGRQ-C, St George’s Respiratory Questionnaire-COPD; TIO, tiotropium (18 mcg).

