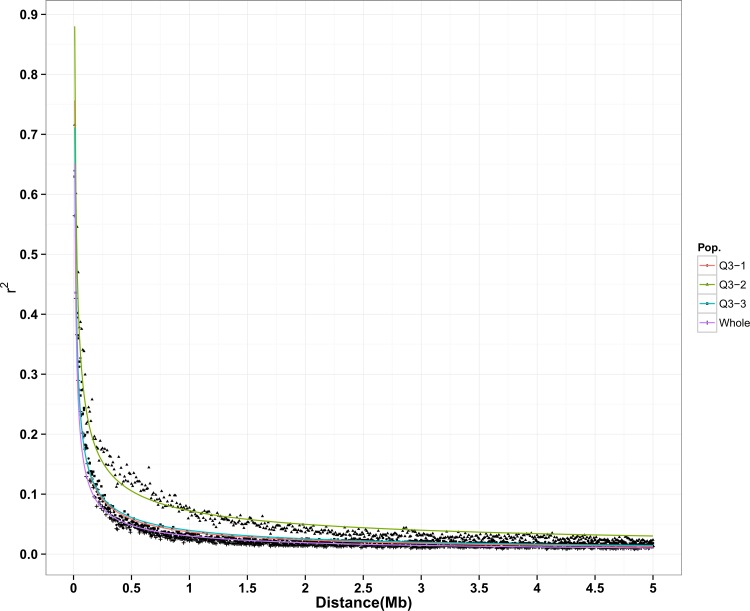
Fig 4. LD decay plot in the whole population and three subpopulations inferred by STRUCTURE.
Y axis is the average r2 value of each 10 kb region and X axis is physical distance between markers in unit of Mb. A power law curve (y = axk) was fitted to determine the physical position (x) corresponding to a given r2 value (y)

