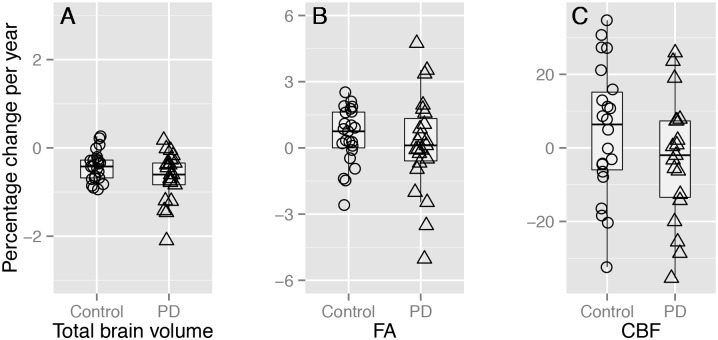
Fig 1. Percentage change in brain metrics over one year.
(A) Total brain volume change (%) per year via SIENA, (B) percent FA change per year, and (C) grey matter CBF change per year (%). (A) shows a significant main effect of time in each group whereas (B) and (C) show no significant change; there were no significant group-by-time interactions in upon total brain volume, FA, or CBF change (see Table 3). Note, the y-axis scale increases from [–3 3] in (A), to [–6 6] in (B), to [–35 35] in (C).

