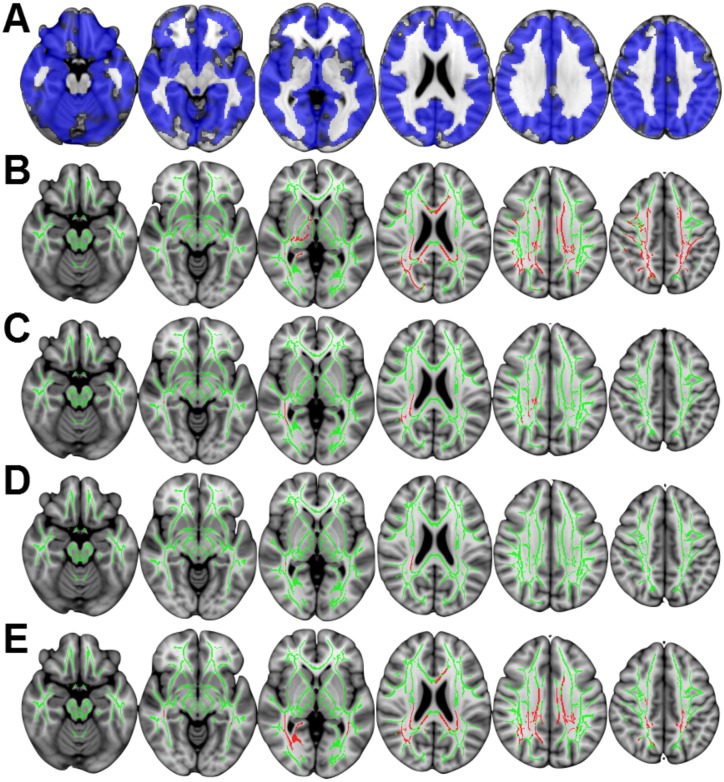
Fig 2. Significant MRI change over time across both groups.
(A) Blue indicates significant grey matter atrophy over one year. (B-E) depict results derived from TBSS; the FA skeleton is shown in green, while red indicates significant change over time. (B) Significant reduction in FA over time in multiple white matter tracts. Significant increases in MD (C), L1 (D), and RD (E) over time. MD and L1 showed localized increases in right superior corona radiata. The pattern of increases in RD over time mirrored the regions identified in the FA comparison. All comparisons p<0.05 corrected for multiple comparisons using threshold free cluster enhancement, displayed in radiological convention (right of image is left of brain). Slices displayed: z = -18, -8, 0, 22, 32, 42 mm.

