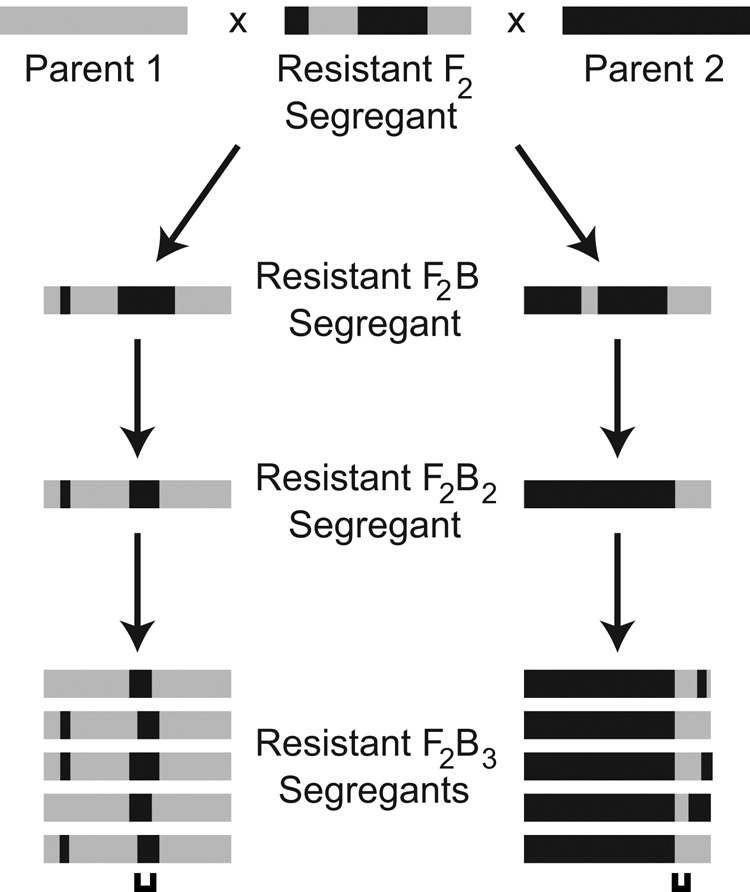
FIGURE 1:

Backcrossing strategy. F2B3 segregants with high hydrogen peroxide resistance were generated through multiple rounds of backcrossing with phenotypic selection. The filled rectangles at each stage represent chromosomes, with gray and black depicting chromosomal regions inherited from Parent 1 and Parent 2, respectively. The brackets shown beneath the chromosomes from resistant F2B3 segregants indicate causal loci. Numbers of individuals screened at each stage of crossing are reported in Materials and Methods.
