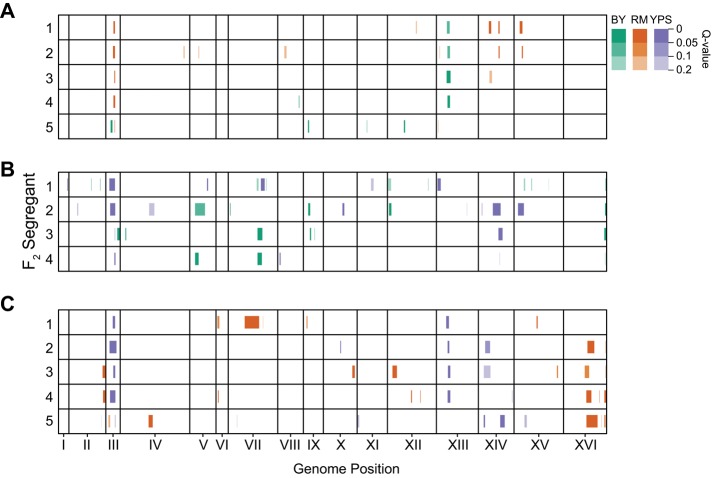
FIGURE 2:
Genetic mapping results. Regions of the genome that showed nominal significance (p ≤ 0.05) are plotted with their associated q values. (A–C) Results from advanced backcross families derived from different BYxRM, BYxYPS, and RMxYPS F2 segregants, respectively. Each row represents an F2 segregant from which two advanced backcross families were derived by recurrent backcrossing to each of the strain’s parents.

