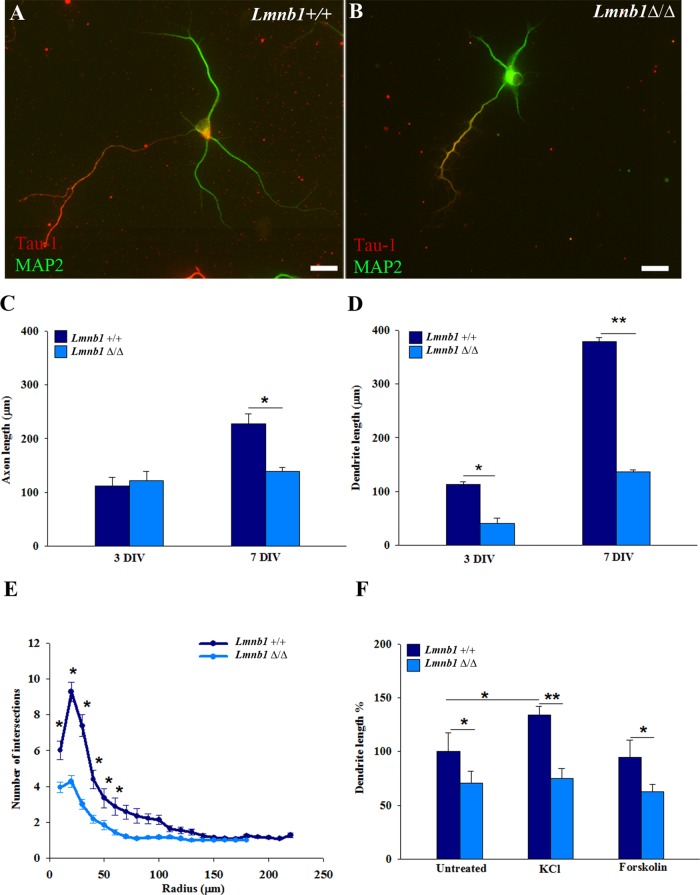
FIGURE 2:
Lmnb1-null cortical neurons develop a deficient dendritic tree. Neuronal morphology was analyzed in Lmnb1+/+ and Lmnb1Δ/Δ primary cortical neurons at 3 and 7 DIV as described in Materials and Methods. (A, B) Representative immunofluorescence images of MAP2 (green) and Tau (red) immunoreactivity in Lmnb1+/+ (A) and Lmnb1Δ/Δ (B) neurons. Scale bars, 20 μm. (C, D) Quantitative analysis of axonal (C) and total dendritic (D) length at 3 and 7 DIV. Bars represent the mean length ± SEM of at least 100 neurons/genotype from four independent experiments. *p < 0.05, **p < 0.01, Student’s t test. (E) Sholl analysis of dendritic tree arborization at 7 DIV. *p < 0.05, two-way ANOVA, followed by multiple comparison with the Holm–Sidak method. (F) Quantitative analysis of total dendrite length in Lmnb1+/+ and Lmnb1Δ/Δ neurons incubated with 18 mM KCl or 12 μm forskolin for 72 h. Data are expressed as mean percentage ± SEM of untreated Lmnb1+/+. At least 100 neurons/genotype for each experimental condition were measured in four independent experiments. *p < 0.05, **p < 0.01, two-way ANOVA, followed by multiple comparison with the Holm–Sidak method.

