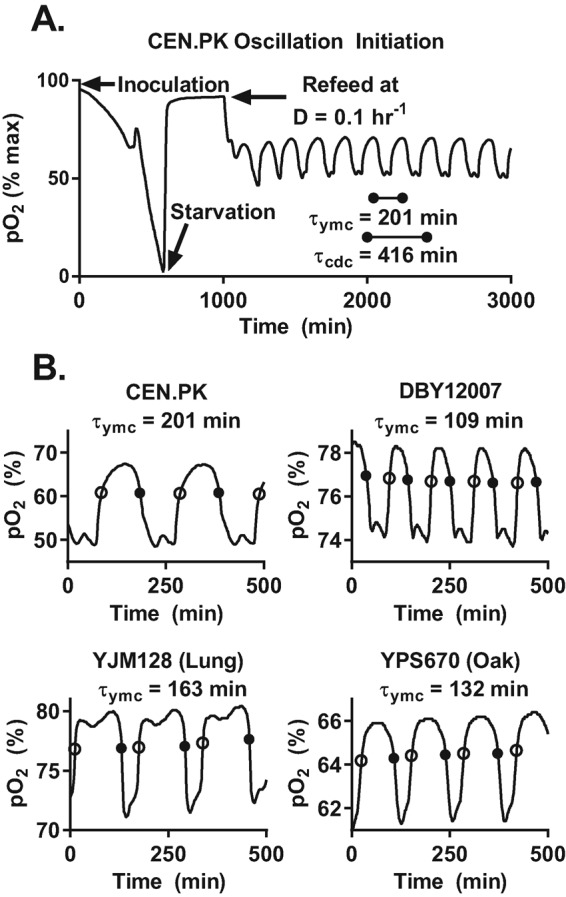
FIGURE 1:

Measurement and analysis of the YMC across different strains. (A) Representative dissolved oxygen trace (pO2) after inoculation of chemostat with strain CEN.PK. Log phase yeasts first aerobically fermented the available glucose to produce ethanol; this was followed by a diauxic shift to pure respiration on ethanol. After a period of yeast starvation, we started the flow of fresh medium into the chemostat at a constant dilution rate (D = 0.1 h−1). The population began to exhibit clear oscillations in pO2 after refeeding. The period of the YMC (τymc) is the elapsed time from peak to peak in pO2 signal. At steady state, the average CDC period (τcdc) must be equal to the inverse of the dilution rate, or τcdc = ln (2)/D. (B) Sample pO2 traces of different yeasts at the same dilution rate. We used lab strains CEN.PK and DBY12007 and wild isolates YJM128 (lung) and YPS670 (oak). We developed an automated analysis pipeline to extract the YMC period, timing of entry into HOC (solid circle), and timing of entry into LOC (open circle) across different strains and dilution rates; see Materials and Methods.
