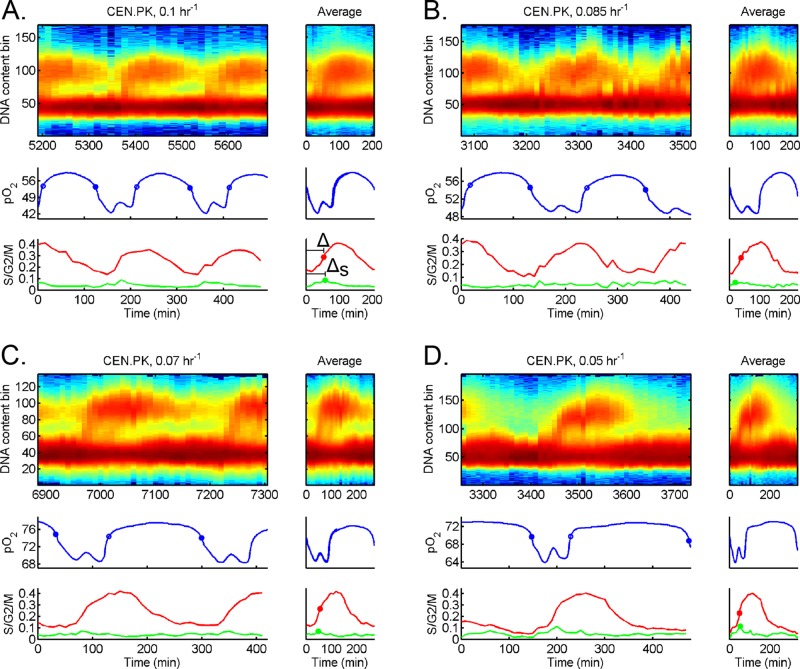
FIGURE 5:
Timing of DNA replication relative to HOC in strain CEN.PK across growth rates. Additional cell cycle analysis for strain CEN.PK at different dilution rates: (A) 0.1 h−1, (B) 0.085 h−1, (C) 0.07 h−1, and (D) 0.05 h−1. The raw DNA content, pO2, S/G2/M fraction, and S fraction are plotted over several YMCs (left). The average over each YMC is plotted to the right of each full data set, where t = 0 corresponds to entry into HOC. We plot the 50% midpoint of S/G2/M fraction (solid red circle) and 100% peak of S fraction (solid green circle). The time of DNA replication (50% of S/G2/M fraction) after entry into HOC is defined as Δ, whereas time of DNA replication (100% of S fraction) is ΔS.

