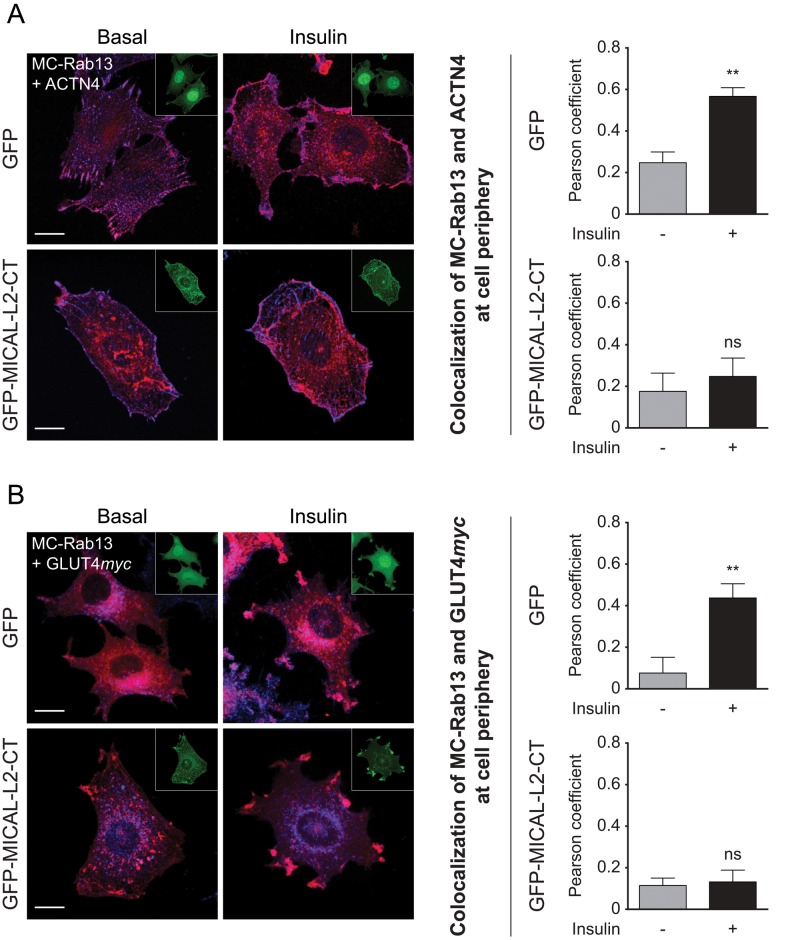
FIGURE 10:
The insulin-stimulated colocalization of MC-Rab13 with both ACTN4 and GLUT4myc at cell periphery is reduced in cells expressing MICAL-L2-CT. (A) L6-GLUT4myc cells cotransfected with either GFP vector and MC-Rab13 or GFP-MICAL-L2-CT and MC-Rab13 were stimulated with insulin or not, fixed, labeled for ACTN4, and analyzed by spinning-disk confocal fluorescence microscopy. Top, collapsed optical z-stack images of GFP (green, inset), MC-Rab13 (red), and ACTN4 (blue). Bottom, images of GFP-MICAL-L2-CT (green, inset), MC-Rab13 (red), and ACTN4 (blue). Graphs show Pearson coefficients of colocalization of MC-Rab13 and ACTN4 at the cell periphery (mean ± SE, **p < 0.01). (B) L6-GLUT4myc cells treated as described were labeled for GLUT4myc and otherwise analyzed as before. Top, images of GFP (green, inset), MC-Rab13 (red), and GLUT4myc (blue). Bottom, images of GFP-MICAL-L2-CT (green, inset), MC-Rab13 (red), and GLUT4myc (blue). Graphs show Pearson coefficient of colocalization of MC-Rab13 and GLUT4myc at the cell periphery (mean ± SE, **p < 0.01, n = 3). Results are representative of three independent experiments (>25 cells/condition per experiment). Scale bars, 10 μm.

