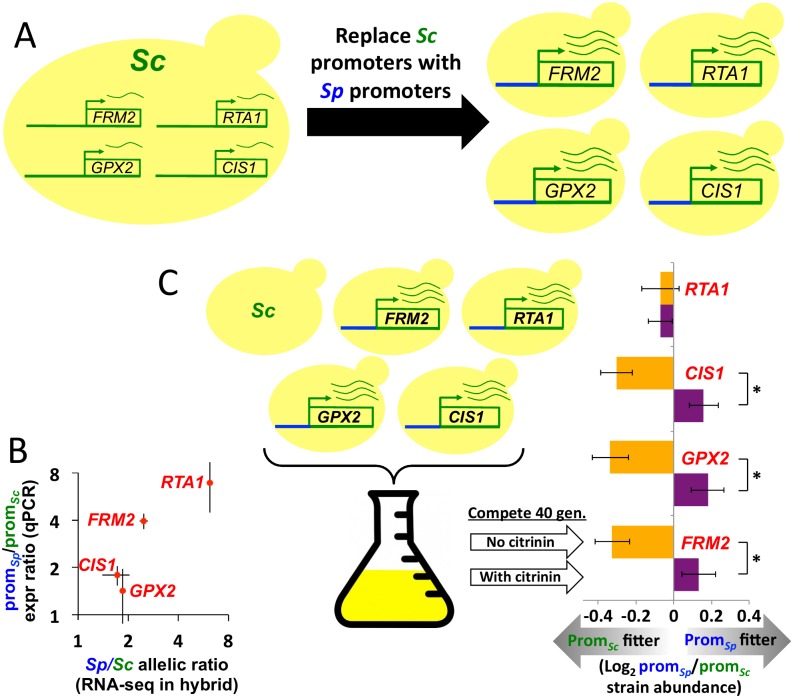
Fig 5. Promoter replacement reveals contributions of individual regulatory regions.
A. Illustration of our promoter replacement strategy. Green promoters on the left are from Sc, blue promoters on the right are from Sp. B. RNA-seq in the Sc/Sp hybrid, which measures the overall cis-regulatory divergence between these strains, is in approximate agreement with the effect of the promoter replacements, measured by qPCR (r = 0.92). Error bars show 1 S.E. C. After competitive growth for 40 generations, promoter replacement strains for 3/4 candidate genes show a similar pattern of fitness advantage in the presence of 300 ppm citrinin, and disadvantage in its absence. Error bars show 1 S.E.

