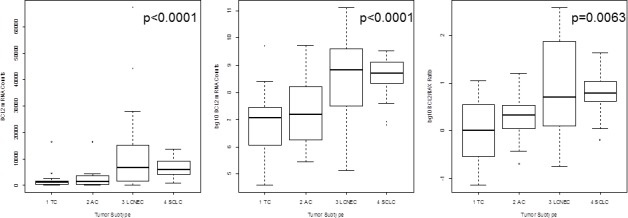
Figure 2. The mRNA expression of BCL2 is shown in logarithmic and linear scale and additionally, the calculated BCL2/BAX ratio is charted in logarithmic scale.

The x-axis shows the tumor type, whereas the y-axis shows the detected mRNA transcripts. BCL2 expression is minimal in TC and increased towards SCLC linking dedifferentiation with increasing proliferative activity. This is confirmed by the BCL2/BAX ratio showing that most TC have an equilibrium between BCL2 (driver of proliferation) and BAX (driver of apoptosis), but increasing malignancy is accompanied by a reduction of apoptosis and increased proliferation.
