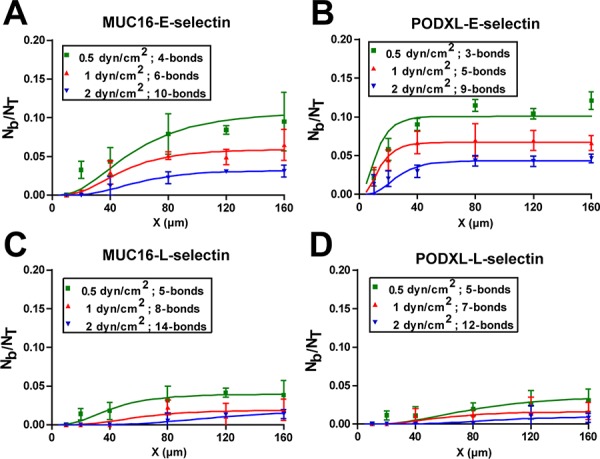
Figure 5. Fitting of the multi-bond model to the experimental data.

Immunopurified MUC16 A, C. or PODXL B, D. coated microspheres flowed over glass surfaces patterned with 3000 sites/μm2 E-selectin (A, B) or L-selectin (C, D) coated patches of varying lengths. The multi-bond model was fitted to the experimental data (points) and optimized for both AcMrMlKon and n-bonds, with the solid lines representing the model prediction.
