
Figure 2. Inactivation of IRE1α kinase or IRE1α RNase activities impedes glioma growth.
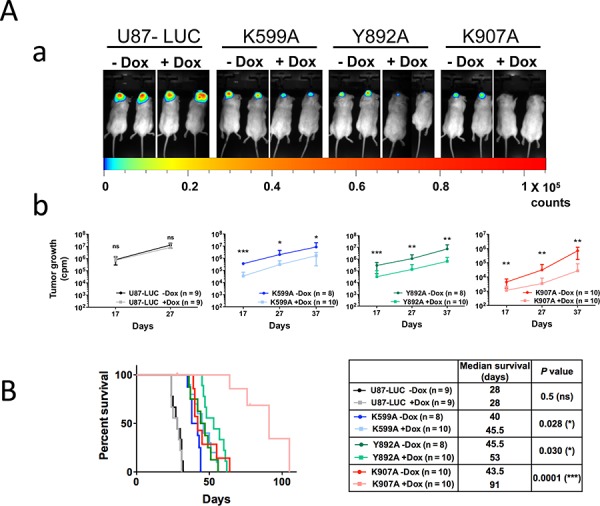
IRE1α cell mutants were stereotactically implanted into mouse brains and tumor progression was measured at different time-intervals by imaging bioluminescence in living mice fed or not with doxycycline. A. Luciferase real-time imaging of U87-LUC, U87-K599A, U87-Y892A and U87- K907A-tumors. Luciferase activity was quantified after selection of the region of interest and tumor volumes were measured at days 17, 27 and 37. Aa. Bioluminescence imaging at day 27. Ab. Time-course evaluation of tumor growth for each cohort. Values are the mean ± SD. Three independent experiments were performed with similar results. B. Kaplan-Meier survival analysis after intracranial implantation of U87-LUC, U87-K599A, U87-Y892A or U87-K907A cells. Left panel, Kaplan-Meier plot. Right panel, characteristic values for each glioma subtype. (n, number of mice; *P < 0.05; ***P < 0.001; ns, P ≥ 0.05).