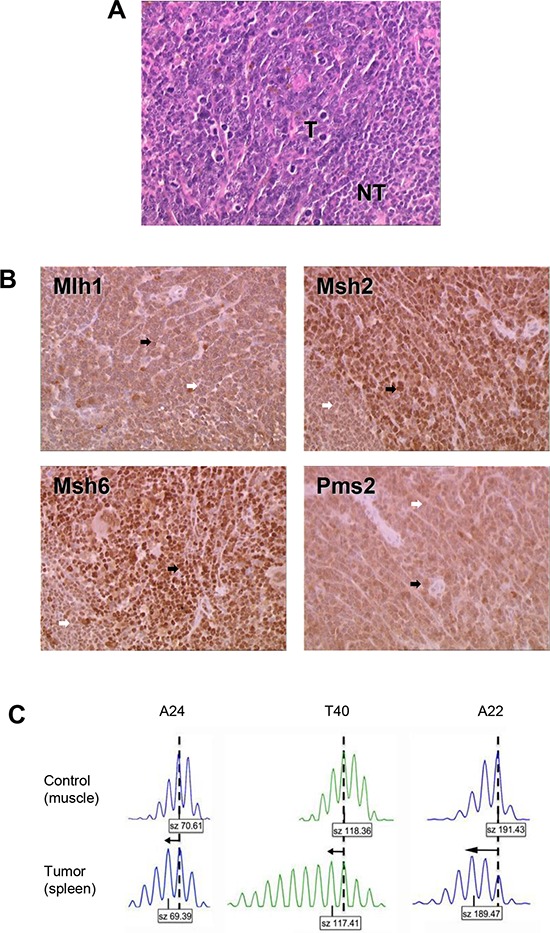
Figure 3. Characterization of the MSI lymphoma syndrome arising in Aza10-treated Msh2wt mouse.

A. Histological characterization showing hematoxylin–eosin staining of splenic lymphoma. T indicates tumor cells; NT indicates normal lymphocytes. B. Immunohistochemistry of spleen tissue sections. Tumor cells (black arrows) stained positively. Normal lymphocytes (white arrows) showed less pronounced staining of MMR proteins due to their lower proliferative rate. Antibodies against Mlh1 and Pms2 provided less intense IHC staining however positive staining was retained in tumor cells (black arrows). An IHC picture of a non-MSI / MMR-proficient splenic lymphoma can be seen in the Supplementary Figure S2 to illustrate that technical point. C. Allelic profiles of the three noncoding microsatellite markers (A24, T40 and A22) displaying shorter alleles (arrows) for the three markers in tumor (spleen) compared to control (muscle) tissue. Dashed vertical lines indicate the predominant allele size observed in control DNA. Predominant allele size (in base pair) is indicated in the box below each profile.
