
Figure 1. Tumor PD-L1 and TIL subtype distribution between primary and metastatic renal cell carcinoma.
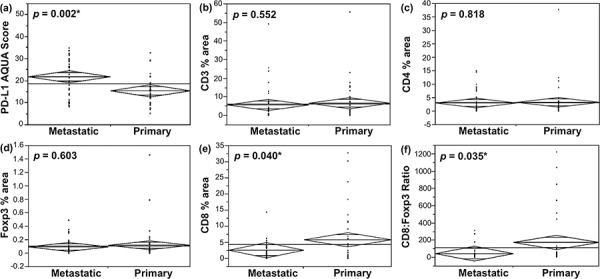
a. One-way analysis of variance (ANOVA) of PD-L1 expression (continuous intensity scores) in RCC lesions demonstrated significantly higher levels of PD-L1 in metastases than in primary tumors [28]. b–d. Densities of CD3+, CD4+ and Foxp3+ TILs (% area per histospot), respectively, did not differ between metastatic and primary lesions. e. Primary RCC tumors had higher CD8+ TIL content than metastases, with the ratio of CD8+ to Foxp3+ T-cells demonstrating the same pattern f.