
Figure 2. Examination of heterogeneity of the total T-cell infiltrate within primary and metastatic RCC lesions.
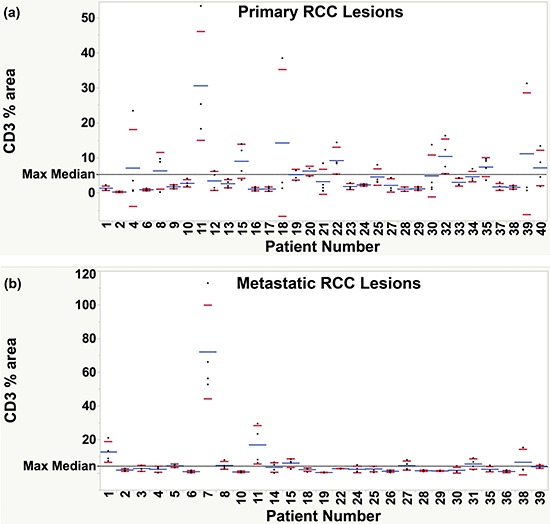
Percent fluorescence area of CD3+ signal was examined for each patient with at least three representative tissue cores. Each dot represents a separate histospot for the corresponding patient, numbered sequentially 1–40. Average % area of CD3+ T-cells is shown for each patient as a blue line. Red marks represent the lower and upper limits of the standard deviation. A reference line (black, dashed) was drawn at the selected threshold for defining high and low density infiltrate (median of the maximum CD3+ T-cell density for all patients). Greater variability in CD3+ T-cell content was observed among the primary specimens a. collected from each patient than among the metastatic cores b. as demonstrated by a greater proportion of patients with values spanning across the selected threshold.