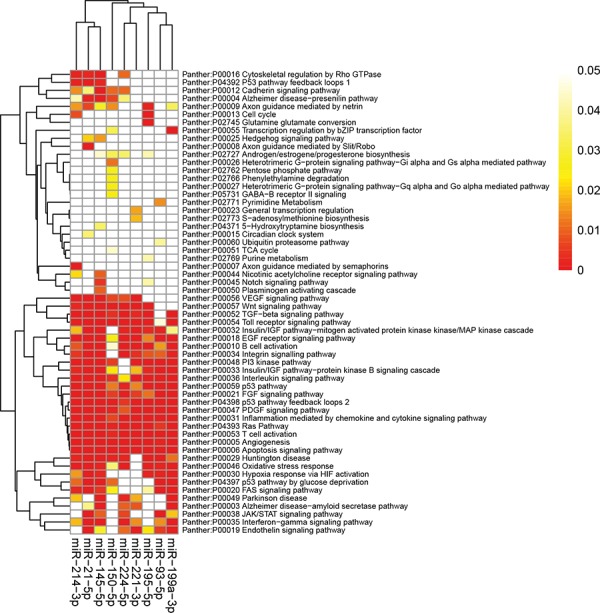
Figure 6. Panther pathway enrichment of targets by validated miRNAs.

The heatmap was constructed using the validated targets and GeneCodis web tool, which showed the results of panther pathway enrichment analysis. The intensity of color represents the FDR-corrected p-value. Clustering was performed using Pearson correlation and average linkage method. FDR, false discovery rate; miRNA, microRNA.
