
Figure 4. State-space characteristics of the coupled networks miR-200/ZEB/LIN28/let-7 and miR-200/ZEB/LIN28/let-7/OVOL, when cells are in {M} phase at α1 = α2 = 0.
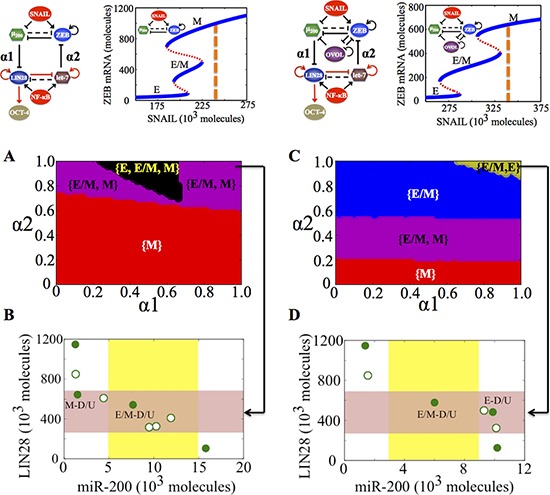
A. Phase diagram of the circuit miR-200/ZEB/LIN28/let-7 representing the values of (α1, α2) for which the different phenotypes can lie in stemness window, for SNAIL = 240 * 103 molecules and NF-kB = 25 * 103 molecules. B. Phenotypic map of the coupled circuit at α1 = α2 = 0.95 and at external signals SNAIL = 240 * 103 molecules and NF-kB = 25 * 103 molecules. Red shaded area shows the ‘stemness window’ based on relative OCT4 levels, and yellow shaded area represents the range of miR-200 levels for the existence of the hybrid E/M phenotype, as noted in [23] for (miR-200/ZEB) circuit and in [36] for (miR-200/ZEB/OVOL) circuit. C, D. represent a similar case for (A), (B) respectively but for the circuit with OVOL, therefore SNAIL = 340 * 103 molecules. Different colors represent different combinations of phenotypes that can gain stemness. Steady state diagram and phase diagram in every column are for the circuit drawn in the topmost row of that column, such that at α1 = α2 = 0 (no coupling between the EMT and stemness circuits), cells are in the phase marked by dashed lines in the bifurcation diagram drawn next to the circuit.