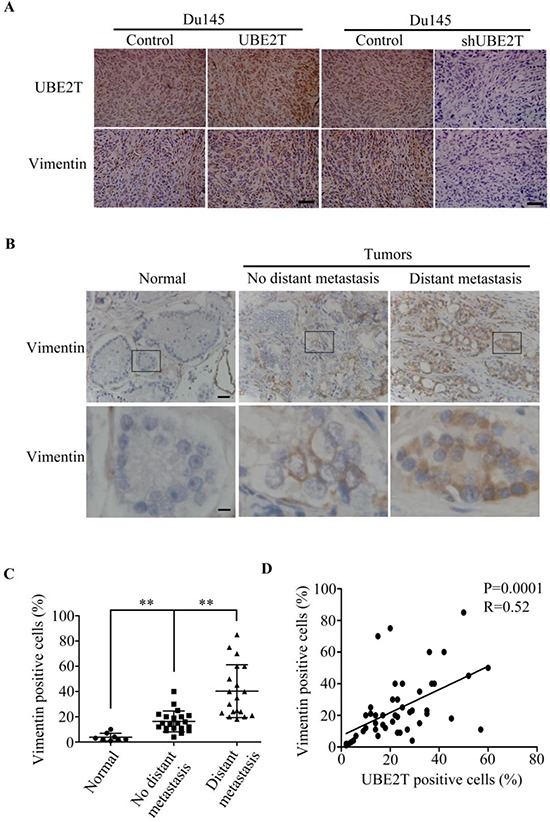
Figure 8. UBE2T expression level is positively associated with vimentin expression.

A. Immunohistochemical analysis of UBE2T and vimentin expression in xenograft prostate tumors. B. Immunohistochemical analysis of vimentin level in a human prostate cancer tissue array as shown in Figure 1. From left to right are representative images of vimentin expression in normal tissue, cancer tissues without and with distant metastasis. Lower panels are the higher magnification of indicated areas in upper panel. C. Analysis of vimentin positive cells in normal tissue, cancer tissues without and with distant metastasis in tissue array. D. Correlation analysis between UBE2T and vimentin levels Lower panels are the higher magnification of indicated areas in upper panel in this tissue array. Normal, normal tissues; No distant metastasis, cancer tissues without distant metastasis; Distant metastasis, cancer tissues with distant metastasis. Scale bars, 100 μm (A upper panel and B) and 20 μm (B, lower panel). **P < 0.01 based on the Student t test. Error bars, SD.
